求助有没有遇到过类似情况的
之前能长时间稳定运行的,中间也没有进行过任何插件更改,近期突然会每隔几个小时卡死一次。
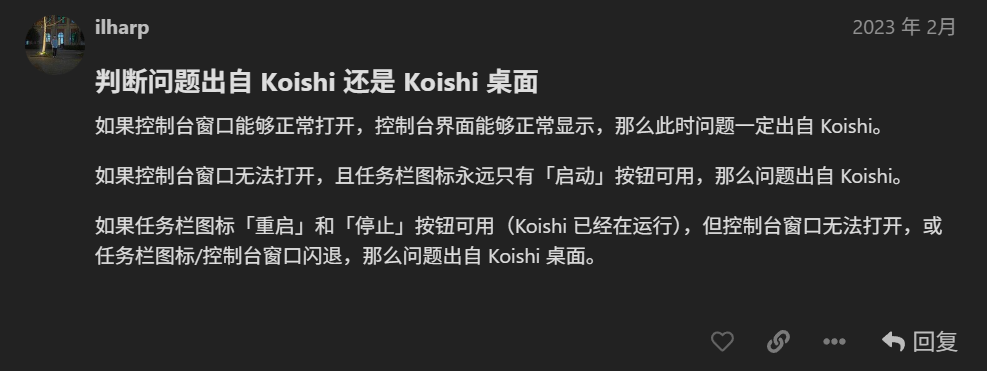
卡死的形式为托盘小图标显示运行但是实例窗口无法打开,重启实例无反应。需要重启整个koishi服务才能恢复正常。
然后运行几小时左右又会卡死
卡死后在任务管理器中能看到一个占用20%多cpu的koishi进程
日志里也没留下任何可疑信息
尝试小火箭更新后问题没有改善。
2 个赞
安装的插件列表
{“id”:1,“content”:“Koishi/4.18.7”,“timestamp”:1763423789499}
{“id”:2,“content”:“apply plugin group:entry”,“timestamp”:1763423789605}
{“id”:3,“content”:“apply plugin http:dr16tp”,“timestamp”:1763423789608}
{“id”:4,“content”:“apply plugin server:qk7nwb”,“timestamp”:1763423789617}
{“id”:5,“content”:“apply plugin group:basic”,“timestamp”:1763423790091}
{“id”:6,“content”:“apply plugin admin:diw26m”,“timestamp”:1763423790093}
{“id”:7,“content”:“apply plugin commands:tjnghu”,“timestamp”:1763423790102}
{“id”:8,“content”:“apply plugin help:01bq36”,“timestamp”:1763423790110}
{“id”:9,“content”:“apply plugin inspect:0l76jz”,“timestamp”:1763423790121}
{“id”:10,“content”:“apply plugin locales:8f9scm”,“timestamp”:1763423790127}
{“id”:11,“content”:“apply plugin rate-limit:sjy9z7”,“timestamp”:1763423790141}
{“id”:12,“content”:“apply plugin telemetry:z94m4m”,“timestamp”:1763423790152}
{“id”:13,“content”:“apply plugin group:console”,“timestamp”:1763423790199}
{“id”:14,“content”:“apply plugin analytics:dzfwk5”,“timestamp”:1763423790201}
{“id”:15,“content”:“apply plugin config:aqhiml”,“timestamp”:1763423790208}
{“id”:16,“content”:“apply plugin console:qyhpj4”,“timestamp”:1763423790372}
{“id”:17,“content”:“apply plugin dataview:o7c4qd”,“timestamp”:1763423790435}
{“id”:18,“content”:“apply plugin desktop:3hdpvr”,“timestamp”:1763423790470}
{“id”:19,“content”:“apply plugin explorer:wk5l1c”,“timestamp”:1763423790485}
{“id”:20,“content”:“apply plugin logger:fsn23y”,“timestamp”:1763423790567}
{“id”:21,“content”:“apply plugin market:lvnd69”,“timestamp”:1763423790579}
{“id”:22,“content”:“apply plugin sandbox:lt68z5”,“timestamp”:1763423790804}
{“id”:23,“content”:“apply plugin status:ssv23x”,“timestamp”:1763423790825}
{“id”:24,“content”:“apply plugin theme-vanilla:vv7wny”,“timestamp”:1763423790914}
{“id”:25,“content”:“apply plugin group:storage”,“timestamp”:1763423790924}
{“id”:26,“content”:“apply plugin database-sqlite:040uim”,“timestamp”:1763423790926}
{“id”:27,“content”:“apply plugin assets-local:kp5bhg”,“timestamp”:1763423790959}
{“id”:28,“content”:“apply plugin group:adapter”,“timestamp”:1763423790974}
{“id”:29,“content”:“apply plugin adapter-satori:n9x6rp”,“timestamp”:1763423790976}
{“id”:30,“content”:“apply plugin group:1riwsj”,“timestamp”:1763423790990}
{“id”:31,“content”:“apply plugin p-qiandao:4i9zwh”,“timestamp”:1763423790992}
{“id”:32,“content”:“apply plugin exchange:ivmcs1”,“timestamp”:1763423791003}
{“id”:33,“content”:“apply plugin p-shop:dh87rm”,“timestamp”:1763423791011}
{“id”:34,“content”:“apply plugin group:vir2vu”,“timestamp”:1763423791029}
{“id”:35,“content”:“apply plugin touhuo-day:w39tv7”,“timestamp”:1763423791031}
{“id”:36,“content”:“apply plugin laoqiu:wsdb87”,“timestamp”:1763423791038}
{“id”:37,“content”:“apply plugin randomimg:887h7t”,“timestamp”:1763423791048}
{“id”:38,“content”:“apply plugin @ifrank/xibao:i4msrt”,“timestamp”:1763423791055}
{“id”:39,“content”:“apply plugin puppeteer:4hibwm”,“timestamp”:1763423791066}
{“id”:40,“content”:“apply plugin imagify:50e4j2”,“timestamp”:1763423792262}
{“id”:41,“content”:“apply plugin repeater:pgoner”,“timestamp”:1763423792281}
{“id”:42,“content”:“apply plugin schedule:wxul7z”,“timestamp”:1763423792291}
{“id”:43,“content”:“apply plugin cache-database:w65tm2”,“timestamp”:1763423792300}
{“id”:44,“content”:“apply plugin yulu-satori:5v045c”,“timestamp”:1763423792313}
{“id”:45,“content”:“apply plugin satori-ai:f5bzrf”,“timestamp”:1763423792735}
{“id”:46,“content”:“apply plugin text-censor:sm3iei”,“timestamp”:1763423792791}
{“id”:47,“content”:“apply plugin shutdown:sp2wex”,“timestamp”:1763423792818}
2 个赞
可能只是webui的进程被杀了,实际上重启实例应该是有反应的
可以试试看浏览器直接访问webui地址。
1 个赞
并非。重启实例无反应,而且bot功能也没有正常运行
2 个赞
这需要提供具体日志才能判断问题
1 个赞
我知道,要是有日志我就自己解决了。问题就在于日志没有任何报错,所以才来这碰碰运气
2 个赞
最新进展。我的一个朋友也遇到了这个问题,目前怀疑是最后一次win10更新后出现的问题。
2 个赞
可以先迁移到项目模板,具体debug一下
看看是什么问题导致的
用koishi desktop不方便定位问题
2 个赞
在koishi本体日志内发现了这个
日志
0000|1|2025-11-17 22:52:43 [E] launcher failed to ping god daemon: failed to connect to daemon: websocket.Dial ws://127.0.0.1:50401/api: dial tcp 127.0.0.1:50401: connectex: No connection could be made because the target machine actively refused it.
0000|3|2025-11-17 22:53:00 [D] launcher 正在重启实例 default
0000|1|2025-11-17 22:53:02 [E] launcher failed to ping god daemon: failed to connect to daemon: websocket.Dial ws://127.0.0.1:50401/api: dial tcp 127.0.0.1:50401: connectex: No connection could be made because the target machine actively refused it.
当实例卡死尝试重启时就会发生这个,不知道是否有线索
2 个赞
跟这部分日志关系不大,Koishi 高 CPU 占用一般是插件写得有问题。推荐用二分法排查插件。
3 个赞
有人解决了吗?帮帮忙
2 个赞